
Every practice has a bank balance. Very few practices have a clear answer for why that balance is what it is. Revenue does not disappear all at once. It leaks a few percentage points at a time
through a coding error here, a missed authorization there, a claim that sat untouched for six weeks because nobody was watching the aging report.
By the time it shows up as a cash flow problem, the root cause is usually months old.
Revenue cycle KPIs exist to close that gap between what a practice earned and what it actually collects. Used correctly, they turn a vague feeling of "billing feels slow" into a specific, fixable number.
This guide covers the 9 KPIs that matter most for independent physicians, multi specialty groups, and healthcare finance leaders who want more than a textbook definition.
For each one, you will find the formula, the benchmark high performing practices hit, what typically causes a weak number, and how to fix it.

A practice that hits all five is, by definition, financially healthy. A practice that misses two or more of them is losing revenue somewhere in the cycle, whether anyone has noticed yet or not.
Why Most Practices Struggle to Track These KPIs Internally
Nobody sets out to lose track of their revenue cycle. It happens because the data lives in three or four disconnected places. The EHR holds the clinical documentation. The clearinghouse holds the claim status. The practice management system holds the ledger. And the person who understands how to reconcile all three is often the same person who is also posting payments, working denials, and answering patient billing calls.
A few patterns show up again and again in practices that lose visibility into their own performance:
-
Metrics get calculated inconsistently. One month, days in accounts receivable is measured against gross charges. The next month, someone uses net charges. The number moves, but nothing about the practice's performance actually changed.
-
Reports are pulled monthly, not managed daily. A denial that could have been corrected and resubmitted within a week sits untouched until the end of month reconciliation, by which point it may be past the payer's timely filing window.
-
Nobody owns the number. KPIs without an accountable owner tend to be reported, discussed, and then quietly ignored until the next report.
-
Front end and back end data never talk to each other. A spike in denials traces back to eligibility verification, but the biller working the denial has no visibility into what happened at check in three weeks earlier.
This is precisely the gap that experienced revenue cycle management services are built to close. A dedicated RCM partner does not just process claims. It maintains continuous KPI monitoring across the entire cycle, from the moment a patient books an appointment to the moment the final dollar is collected, so problems get caught in days instead of discovered in quarters.
Use this table as your dashboard checklist. Every metric below is covered in full detail further down the page.
|
KPI |
What It Measures |
Target Benchmark |
|
Clean Claim Rate |
Claims paid with no manual touch |
95%+ |
|
First Pass Resolution Rate |
Claims resolved on the first submission |
90%+ |
|
Initial Claim Acceptance Rate |
Claims accepted by the payer for processing |
90%+ |
|
Charge Lag |
Days from service to claim submission |
Under 2 to 3 days |
|
Claim Denial Rate |
Share of claims denied by payers |
Under 5%, best in class under 3% |
|
Denial Write Off Percentage |
Denied revenue never recovered |
Under 1% of net revenue |
|
Days in Accounts Receivable |
Average days to collect after service |
Under 30 to 40 days |
|
Aging Accounts Receivable |
A/R distributed across 0-30, 31-60, 61-90, 90+ buckets |
75%+ of A/R inside 60 days |
|
Average Reimbursement Time |
Days from claim submission to payment |
10 to 14 days Medicare; 30 to 45 days commercial/MA |
Claims Accuracy and Submission KPIs
Everything downstream in the revenue cycle depends on what happens in the first 72 hours after a patient visit. These five KPIs measure whether a claim leaves the building clean, complete, and on time.
1- Clean Claim Rate
|
Definition |
The percentage of claims that are accepted and paid by the payer with no manual intervention, correction, or rejection. |
|
Formula |
(Clean Claims Submitted ÷ Total Claims Submitted) × 100 |
|
Benchmark |
95% or higher for a well run practice. Below 90% signals a front end or coding problem worth investigating immediately. |
Why It Matters
Clean claim rate is the single best early warning indicator in the entire revenue cycle. A weak number here does not just mean one claim got delayed. It means the same root cause, whether it is a registration error or a coding gap, is repeating across dozens or hundreds of future claims until someone fixes the source.
What Drives a Weak Number
-
Incomplete or outdated patient demographic and insurance data at check in
-
Missing prior authorization before a service is rendered
-
Coding errors, mismatched modifiers, or outdated CPT and ICD-10 code sets
-
Eligibility not verified before the date of service
How to Improve It
-
Verify eligibility and benefits at every visit, not just for new patients
-
Run claims through scrubbing software before submission to catch errors proactively
-
Audit high denial CPT codes monthly and retrain staff on the specific pattern found
-
Standardize registration data entry with required field validation
Outsourced RCM partners build eligibility verification and claim scrubbing directly into the front end workflow, which is why clients working with an established medical billing company routinely see clean claim rates in the mid to high 90s rather than the industry average.
2- First Pass Resolution Rate (FPRR)
|
Definition |
The percentage of claims fully resolved, meaning paid or appropriately adjusted, after a single submission with no rework. |
|
Formula |
(Claims Resolved on First Submission ÷ Total Claims Submitted) × 100 |
|
Benchmark |
90% or higher. |
Why It Matters
FPRR is closely related to clean claim rate but measures the outcome rather than the submission quality. A claim can be technically clean and still require rework if the payer applies an unexpected edit or bundling rule. FPRR captures that gap and reflects how well your team anticipates payer specific behavior, not just claim formatting.
What Drives a Weak Number
-
Payer specific edits and bundling rules that are not built into the billing workflow
-
Staff working claims reactively instead of proactively flagging historically problematic payers
-
Inconsistent use of modifiers across similar procedures
How to Improve It
-
Build payer specific rule sets into your claim scrubber rather than relying on generic edits
-
Track FPRR by payer, not just as a practice wide average, to isolate which contracts need attention
-
Give billing staff direct access to denial trend data so they can adjust submission habits in real time
3-Initial Claim Acceptance Rate
|
Definition |
The percentage of claims accepted by the payer's system for processing, regardless of whether they are ultimately paid or denied. |
|
Formula |
(Claims Accepted for Processing ÷ Total Claims Submitted) × 100 |
|
Benchmark |
90% or higher. |
Why It Matters
This metric is often confused with clean claim rate, but the distinction matters. Initial acceptance happens before adjudication. A claim can be accepted for processing and still be denied later for medical necessity or coverage reasons. Tracking acceptance separately from denial isolates purely technical and administrative errors, which are the fastest and cheapest to fix.
What Drives a Weak Number
-
Invalid or mismatched payer identification numbers
-
Missing NPI, taxonomy code, or provider enrollment gaps
-
Formatting errors in the 837 claim file itself
How to Improve It
-
Confirm provider enrollment and credentialing status with every payer before billing under that provider
-
Reconcile payer ID tables quarterly, since payers periodically update routing and clearinghouse requirements
-
Monitor clearinghouse rejection reports daily rather than waiting for the payer's own rejection notice
4- Charge Lag
|
Definition |
The number of days between the date of service and the date the claim is actually submitted to the payer. |
|
Formula |
Claim Submission Date − Date of Service |
|
Benchmark |
Under 2 to 3 days for practices. Hospitals may tolerate up to 5 to 7 days. |
Why It Matters
Charge lag is one of the few KPIs almost entirely within the practice's control. Payers do not cause charge lag. Internal workflow does. Every extra day of lag pushes payment further out and increases the odds that a claim will bump into a timely filing deadline, especially with payers that enforce 90 day or shorter filing windows.
What Drives a Weak Number
-
Providers completing documentation days after the encounter instead of same day
-
Coding staff batching claims weekly instead of processing daily
-
Missing charge tickets or superbills that require manual follow up before billing can begin
How to Improve It
-
Set an internal same day or next day documentation policy and track provider level compliance
-
Batch and submit claims daily rather than weekly
-
Automate charge creation directly from the EHR encounter close, removing the manual handoff step entirely
Denial Management KPIs
Denials are the most expensive category of revenue cycle failure because they combine lost or delayed revenue with the direct labor cost of appeals and rework. These two KPIs measure both the size of the problem and how much of it becomes permanent loss.
5- Claim Denial Rate
|
Definition |
The percentage of submitted claims that are denied, in whole or in part, by the payer. |
|
Formula |
(Total Value of Denied Claims ÷ Total Value of Submitted Claims) × 100 |
|
Benchmark |
Under 5%. Best in class practices operate under 3%. Industry data shows initial denial rates trending between 8% and 15% across specialties, with front end registration and eligibility errors responsible for roughly a quarter of preventable denials. |
Why It Matters
Every percentage point of denial rate represents delayed cash flow at minimum, and permanently lost revenue at worst, since not every denial gets appealed and not every appeal succeeds. Denial rate also functions as a diagnostic tool. The specific denial codes and reason categories point directly at which part of the revenue cycle is failing, whether that is eligibility, authorization, coding, or documentation.
What Drives a Weak Number
-
Eligibility and registration errors, historically the single largest denial category
-
Missing or expired prior authorizations, an area that continues to tighten under evolving CMS prior authorization initiatives
-
Medical necessity documentation gaps
-
Duplicate claims and timely filing violations
Warning Sign
If your denial rate is trending upward month over month even though claim volume is flat, the cause is almost never random. It usually traces to a specific payer policy change, a new provider whose credentialing has not fully processed, or a coding update your team has not yet adapted to. Recent regulatory changes, including CMS's expanding prior authorization requirements under the WISeR model, are actively reshaping denial patterns for practices that bill Medicare. Our breakdown of the CMS WISeR Model covers what practices need to adjust for in 2026.
How to Improve It
-
Categorize every denial by root cause, not just by payer, so patterns are visible at the source level
-
Build a denial prevention feedback loop between the billing team and front office staff
-
Prioritize appeals by dollar value and statistical likelihood of success rather than working denials in the order they arrive
-
Track denial rate by provider and by CPT code, since certain procedures and certain documentation habits consistently drive disproportionate denials
This is one of the clearest areas where outsourced RCM pays for itself. A dedicated revenue cycle management partner works denials within 24 to 48 hours of receipt rather than in a monthly batch, which materially improves both recovery rates and the odds of staying inside appeal deadlines.
6- Denial Write Off Percentage
|
Definition |
The dollar value of denied claims that are ultimately written off as unrecoverable, expressed as a percentage of net revenue or of insurance collections. |
|
Formula |
(Dollar Value of Denials Written Off ÷ Total Insurance Collections) × 100 |
|
Benchmark |
Under 1% of net revenue for a well managed practice. |
Why It Matters
Denial rate tells you how much is initially rejected. Write off percentage tells you how much of that is never recovered. A practice can have a moderate denial rate but a very low write off percentage if its appeals process is strong, or a low denial rate but a high write off percentage if denials that do occur are simply abandoned rather than appealed. The two numbers together give a complete picture.
What Drives a Weak Number
-
No structured appeals process, so denials over a certain age get written off by default
-
Staff lacking the time or payer specific knowledge to pursue appeals effectively
-
Missed appeal filing deadlines, which are often shorter and less forgiving than original claim filing deadlines
How to Improve It
-
Set a firm internal policy that no denial is written off without a documented appeal attempt above a defined dollar threshold
-
Track appeal success rates by payer and by denial reason to focus effort where it pays off
-
Assign denial write offs to a supervisor approval step rather than allowing automatic aging write offs
Accounts Receivable and Aging KPIs
These three KPIs measure how efficiently earned revenue converts into collected cash, and how much risk is building up the longer that conversion takes.
7- Days in Accounts Receivable (Days in A/R)
|
Definition |
The average number of days it takes a practice to collect payment after a service is rendered. |
|
Formula |
Total Accounts Receivable ÷ Average Daily Charges (Average Daily Charges = Total Charges for Period ÷ Number of Days in Period) |
|
Benchmark |
Under 30 to 40 days for high performing practices. 31 to 45 days is generally acceptable. Beyond 50 days signals a serious cash flow concern. |
Why It Matters
Days in A/R is the most widely tracked revenue cycle KPI for a reason. It is a single number that reflects the combined efficiency of every upstream process, coding accuracy, denial management, payer follow up, and patient collections, all at once. It is also the number that most directly determines whether a practice can meet payroll and overhead without relying on a line of credit.
What Drives a Weak Number
-
High charge lag delaying the start of the collection clock
-
Claims sitting unworked past 30 or 60 days without active follow up
-
A high denial rate that pushes resolution timelines out by weeks or months
-
Slow payer categories, particularly Medicare Advantage plans, which frequently pay closer to 30 to 45 days compared to 10 to 14 days for traditional Medicare
How to Improve It
-
Work claims in priority order by age and dollar value, starting with claims closest to timely filing or appeal deadlines
-
Reduce charge lag first, since it directly shortens the entire A/R cycle before any collection activity even begins
-
Set a hard internal follow up cadence, for example every 15 days, rather than allowing claims to age passively
Expert Tip
Track days in A/R separately by payer category. A blended practice wide number can look acceptable while masking a Medicare Advantage segment running at 65 days that is quietly dragging down an otherwise healthy traditional Medicare and commercial mix.
8- Aging Accounts Receivable
|
Definition |
The distribution of outstanding accounts receivable across standard aging buckets, typically 0 to 30, 31 to 60, 61 to 90, and 90 plus days. |
|
Formula |
Not a single formula. Reported as the percentage of total A/R dollars falling into each aging bucket. |
|
Benchmark |
At least 75% of total A/R should sit within the 0 to 60 day range for a healthy practice. |
Why It Matters
Days in A/R gives you one average number. The aging report tells you where the actual problem lives. A practice can have an acceptable average days in A/R while still carrying a dangerous concentration of claims in the 90 plus bucket, offset by a large volume of very recent, fast paying claims. The distribution matters as much as the average.
What Drives a Weak Number
-
No structured escalation process as claims cross from one aging bucket into the next
-
Staff prioritizing new claims over aging follow up because new claims are easier to resolve
-
Missing appeal deadlines that permanently move a claim from a collectible bucket to a write off
How to Improve It
-
Review the aging report weekly, not monthly, and assign specific claims to specific staff by bucket
-
Set escalation triggers so claims automatically flag for supervisor review once they cross 60 days
-
Separate the aging report by payer and by denial status to prioritize the claims most likely to be recoverable
Operational Efficiency KPIs
This KPI measures the internal speed and cost of the revenue cycle machine itself, independent of payer behavior.
9- Average Reimbursement Time
|
Definition |
The average number of days between claim submission and payment receipt. |
|
Formula |
Average (Payment Received Date − Claim Submission Date) across all paid claims |
|
Benchmark |
10 to 14 days for traditional Medicare. 30 to 45 days is typical for commercial payers and Medicare Advantage plans, though this varies by state prompt pay laws. |
Why It Matters
This KPI is a direct measure of payer performance rather than internal process. It matters most for cash flow forecasting, since a practice with a heavy Medicare Advantage or slow commercial payer mix needs to plan working capital differently than a practice dominated by traditional Medicare.
What Drives a Weak Number
-
A payer mix weighted toward historically slower paying plans
-
Claims requiring additional documentation requests, which reset the payer's processing clock
-
Not tracking or enforcing state prompt pay law timelines, which most payers are contractually bound to
How to Improve It
-
Track average reimbursement time by individual payer, not as a single blended figure
-
Know your state's prompt pay requirements and escalate any payer that consistently exceeds them
-
Reduce the frequency of additional documentation requests by submitting complete, well documented claims the first time
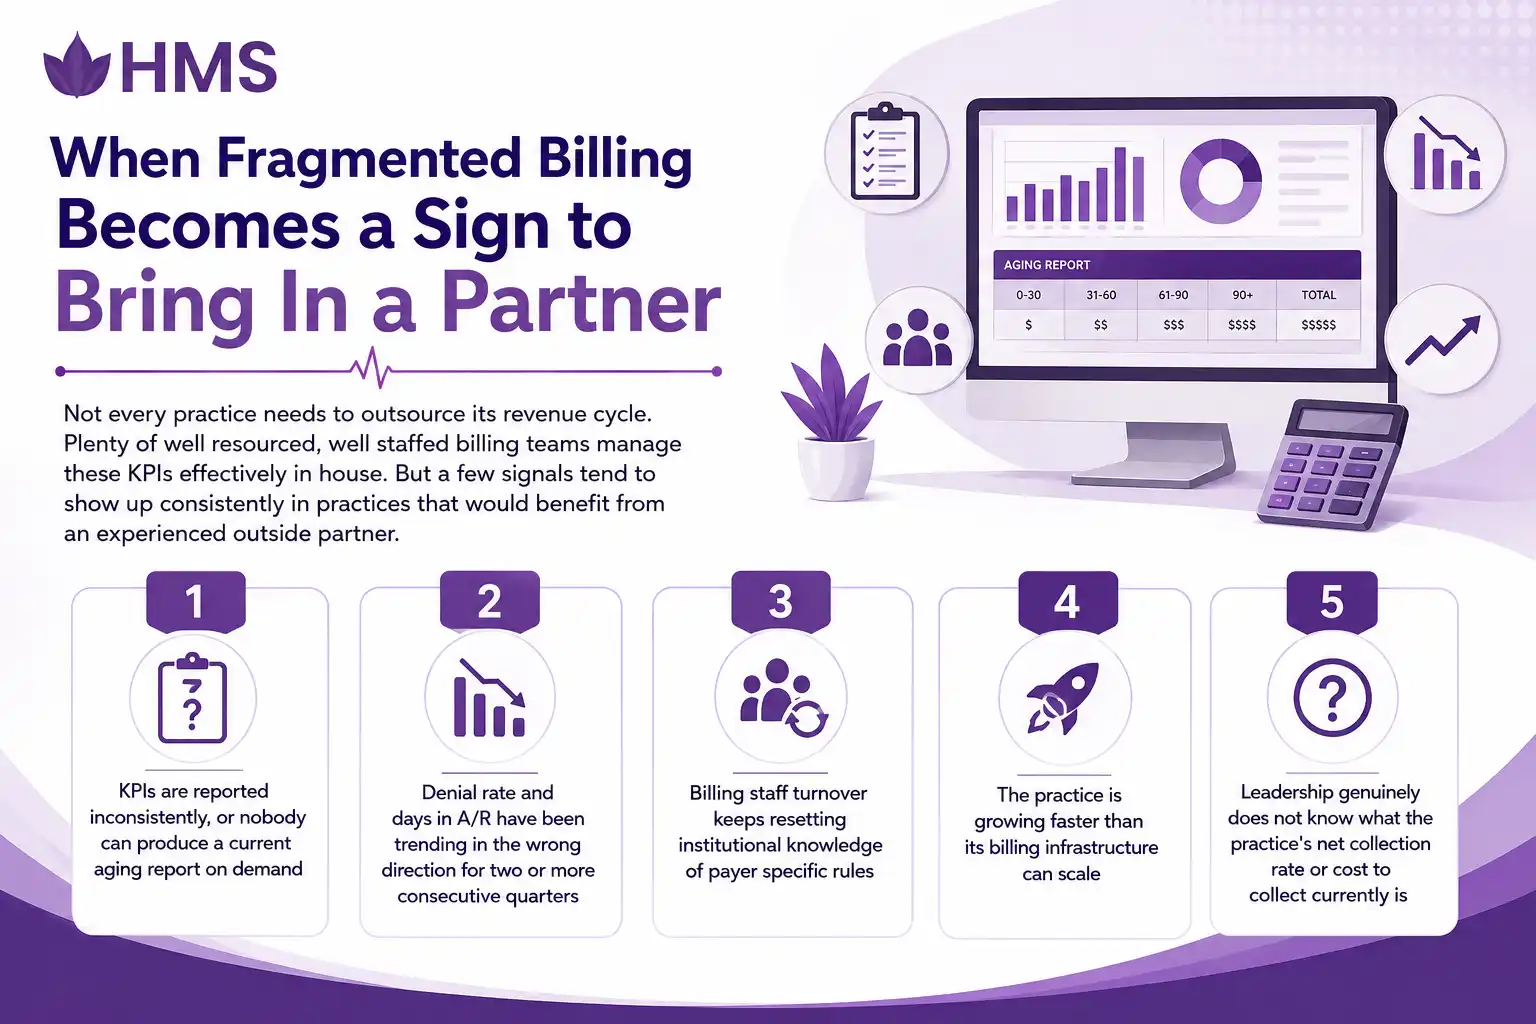
When Fragmented Billing Becomes a Sign to Bring In a Partner
Not every practice needs to outsource its revenue cycle. Plenty of well resourced, well staffed billing teams manage these KPIs effectively in house. But a few signals tend to show up consistently in practices that would benefit from an experienced outside partner.
-
KPIs are reported inconsistently, or nobody can produce a current aging report on demand
-
Denial rate and days in A/R have been trending in the wrong direction for two or more consecutive quarters
-
Billing staff turnover keeps resetting institutional knowledge of payer specific rules
-
The practice is growing faster than its billing infrastructure can scale
-
Leadership genuinely does not know what the practice's net collection rate or cost to collect currently is
An experienced revenue cycle partner brings continuous KPI monitoring, payer specific expertise built over years of claims across many practices, and dedicated staff whose only job is managing the metrics on this page. For practices weighing that decision, our revenue partner solutions page outlines how HMS structures support for solo practices, groups, and hospital based organizations differently, since the right approach depends heavily on practice size and specialty.
Note:
For more on the individual pieces of the revenue cycle referenced throughout this guide, explore our RCM University resource library, or browse the full HMS blog for ongoing coverage of billing, coding, and compliance topics, including our recent breakdowns of verification of benefits and denial remark codes.
See Where Your Practice Stands
Book Appointment
FAQ! Need Help?
A clean claim rate of 95% or higher is considered strong. Anything below 90% typically signals a specific, fixable problem in eligibility verification, coding, or registration workflows.
Days in A/R is calculated by dividing total accounts receivable by average daily charges, where average daily charges equals total charges for a period divided by the number of days in that period. Most practices should target under 30 to 40 days.
Under 5% is a reasonable target, with best in class practices operating under 3%. Industry wide initial denial rates have trended higher in recent years, often between 8% and 15%, which makes active denial management increasingly important rather than optional.
2% to 4% of net patient revenue is the widely cited industry benchmark for a well managed revenue cycle operation, whether handled in house or outsourced.
ABOUT AUTHOR

Temba Altman
As a blog writer with years of experience in the healthcare industry, I have got what it takes to write well-researched content that adds value for the audience. I am a curious individual by nature, driven by passion and I translate that into my writings. I aspire to be among the leading content writers in the world.